Impact of Economic Sanctions on the Russian Economy (As of June 20, 2022)

June 30, 2022
Shinichiro Tabata
Professor, Slavic-Eurasian Research Center, Hokkaido University
This report analyzes the impact of economic sanctions on the Russian economy as of June 20, 2022. Predictions are also described whenever possible.
1. GDP
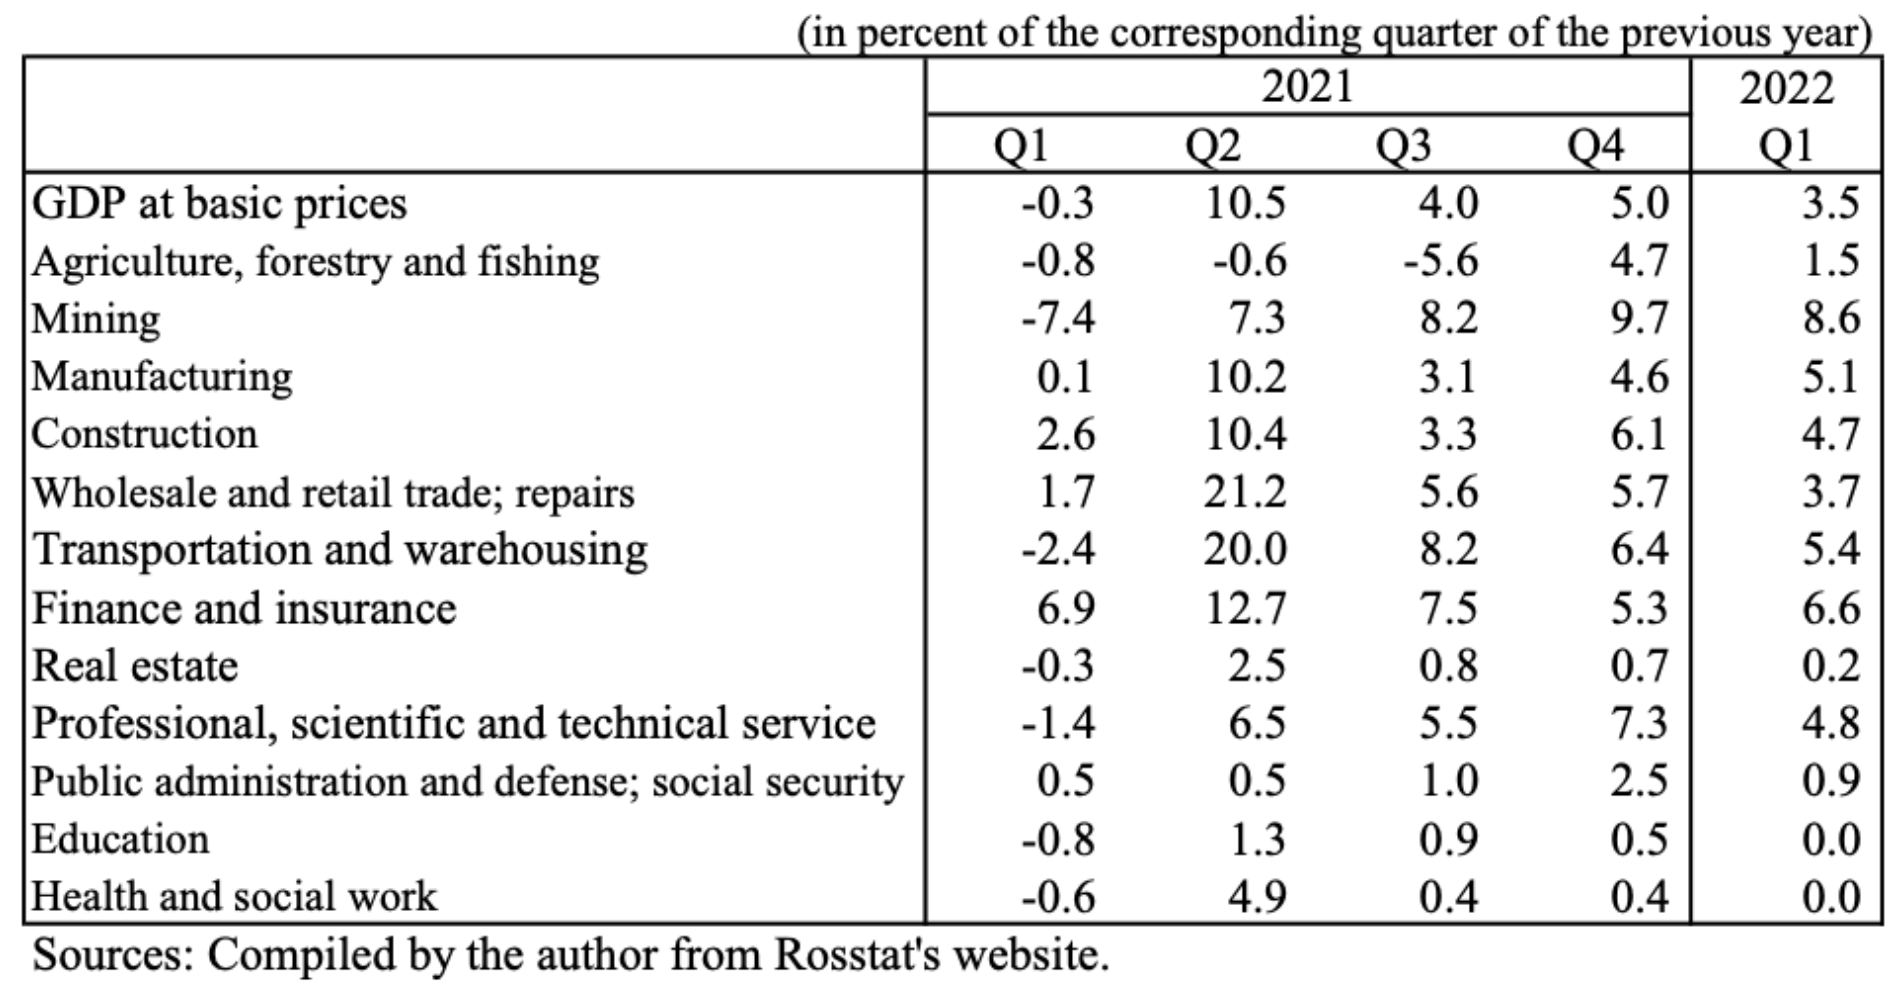
Russia’s GDP grew 3.5% in January-March (Chart 1) compared to the previous year. In January-March, it appears that the favorable economic conditions in 2021 remained strong. The growth rates are high in the key sectors: mining, manufacturing, construction, and transportation and warehousing. However, the apparently high rates may have been contributed by the low performance in the first quarter of 2021. The forecasts for Russia’s economic growth in 2022 by the Ministry of Economic Development of the Russian Federation, the Central Bank of Russia, the IMF, and the World Bank are generally in the range of negative 8-10%.
Chart 1. Growth rate of Russia’s GDP by industry
2. Industrial Production
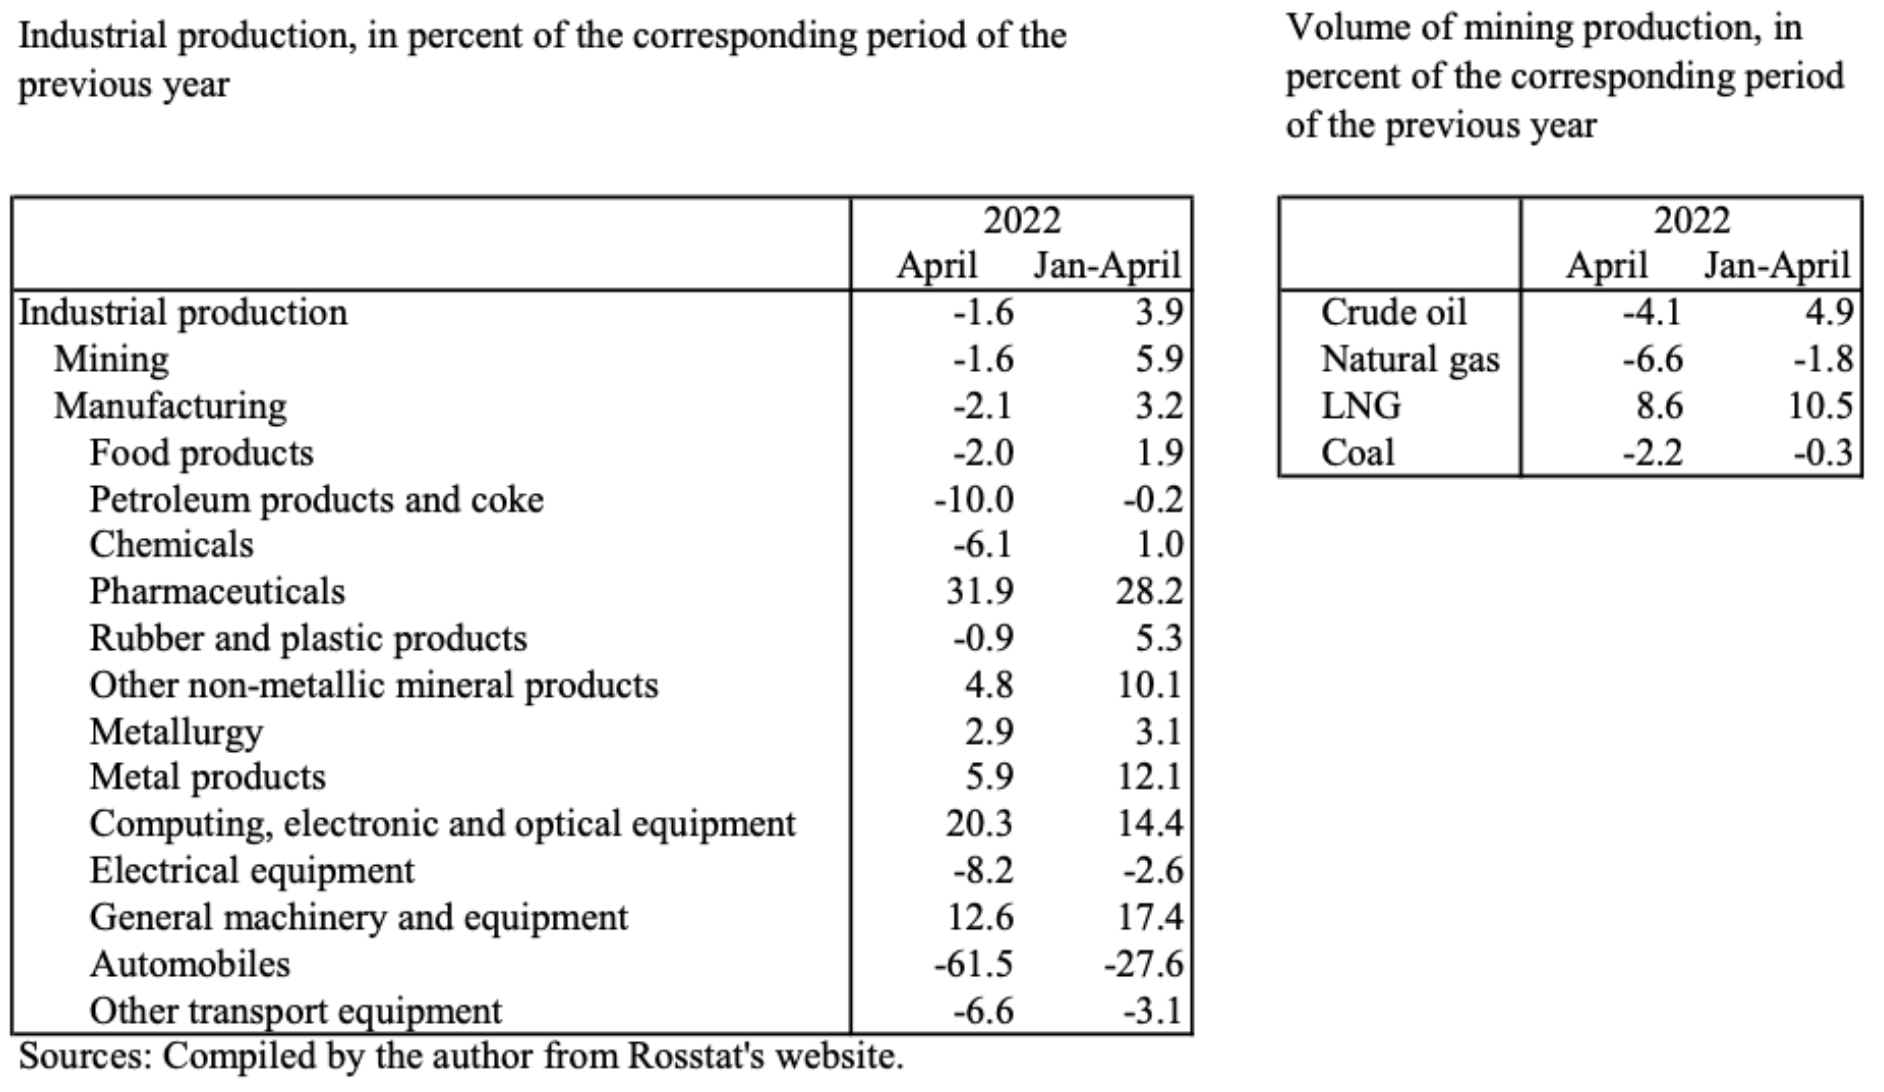
Industrial production increased 3.9% in the period from January to April but fell around 1.6% in April compared to the same periods of the previous year, indicating that the economic sanctions are beginning to have an impact (Chart 2). The breakdown for April shows a 1.6% decline in the mining sector and a 2.1% decline in the manufacturing sector, both compared to April of the previous year. Looking at April’s production in the mining sector, natural gas, crude oil, and coal production had respective decreases of 6.6%, 4.1%, and 2.2%, while LNG production increased 8.6%. In the manufacturing sector, output in April fell 61.5% in automobiles and 8.2% in electrical machinery, showing that the withdrawal of Western companies from Russia has had a significant impact. In addition, petroleum products and coke fell 10.0%, other transportation equipment 6.6%, chemicals 6.1%, and food 2.0%. The impact of the Western ban on exports of high-tech components and other products is also expected to emerge in the future.
Chart 2. Growth rate of Russia’s industrial production by industrial sector
3. International Trade
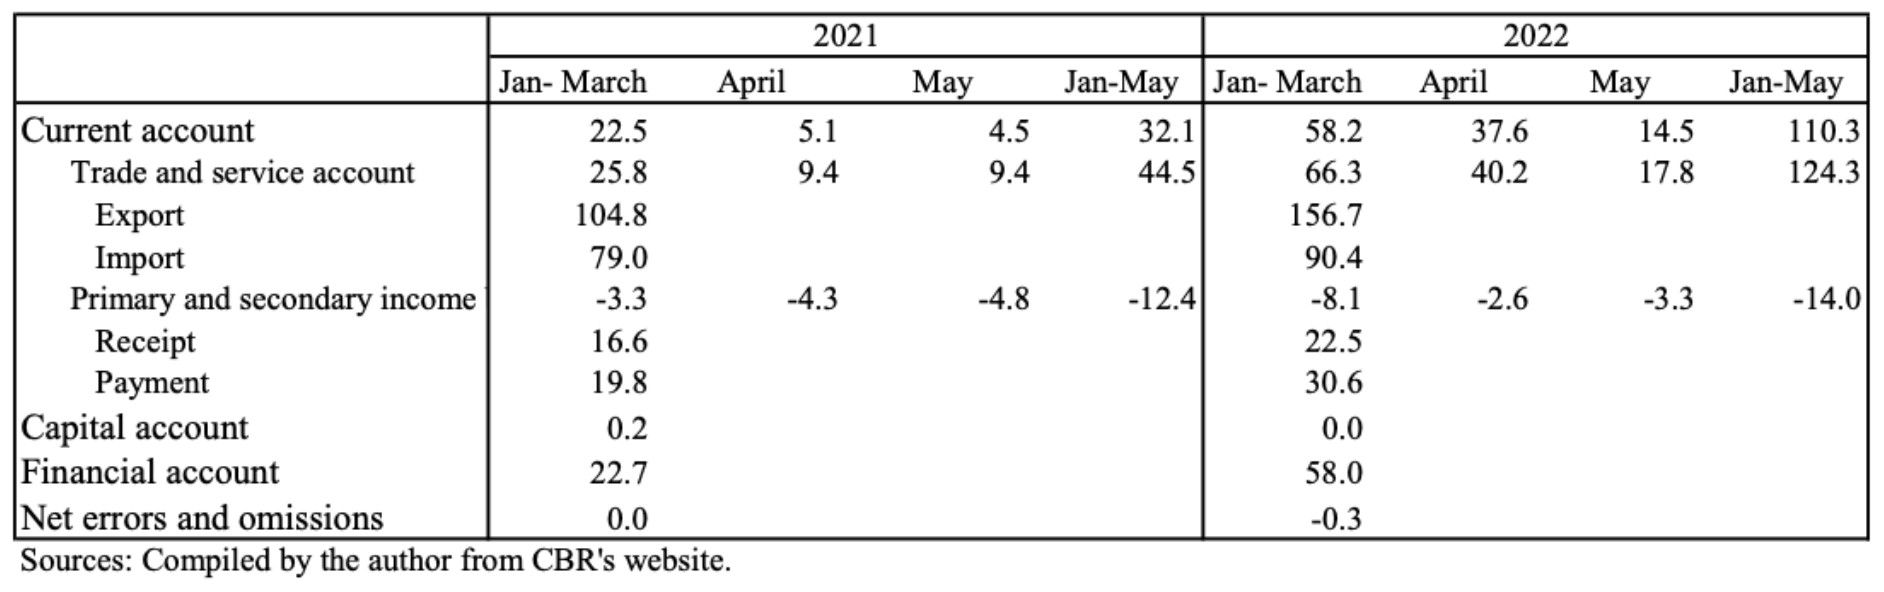
The Federal Customs Service of Russia has not released any trade-related statistics since April, and the website remains inaccessible. The Central Bank of Russia has not released a detailed balance of payments since April. The information on trade and balance of payments available at this point is almost limited to information in Chart 3. The January-March period shows a marked increase in exports, leading to a substantial increase in the trade and services account as well as current account surpluses compared to the same period last year. The increase in exports is mainly due to the sharp rise in oil and gas prices. This trend continued in April and May, and the trade and services account and current account surpluses for January-May were about three times larger than in the same period of the previous year. However, it should be noted that the surpluses in May were less than half compared to April. Whether the increasing trend in the trade and services balance and the current account balance will continue depends on oil and gas exports.
Chart 3. Balance of payments of Russia, in billion dollars
4. Exchange Rate
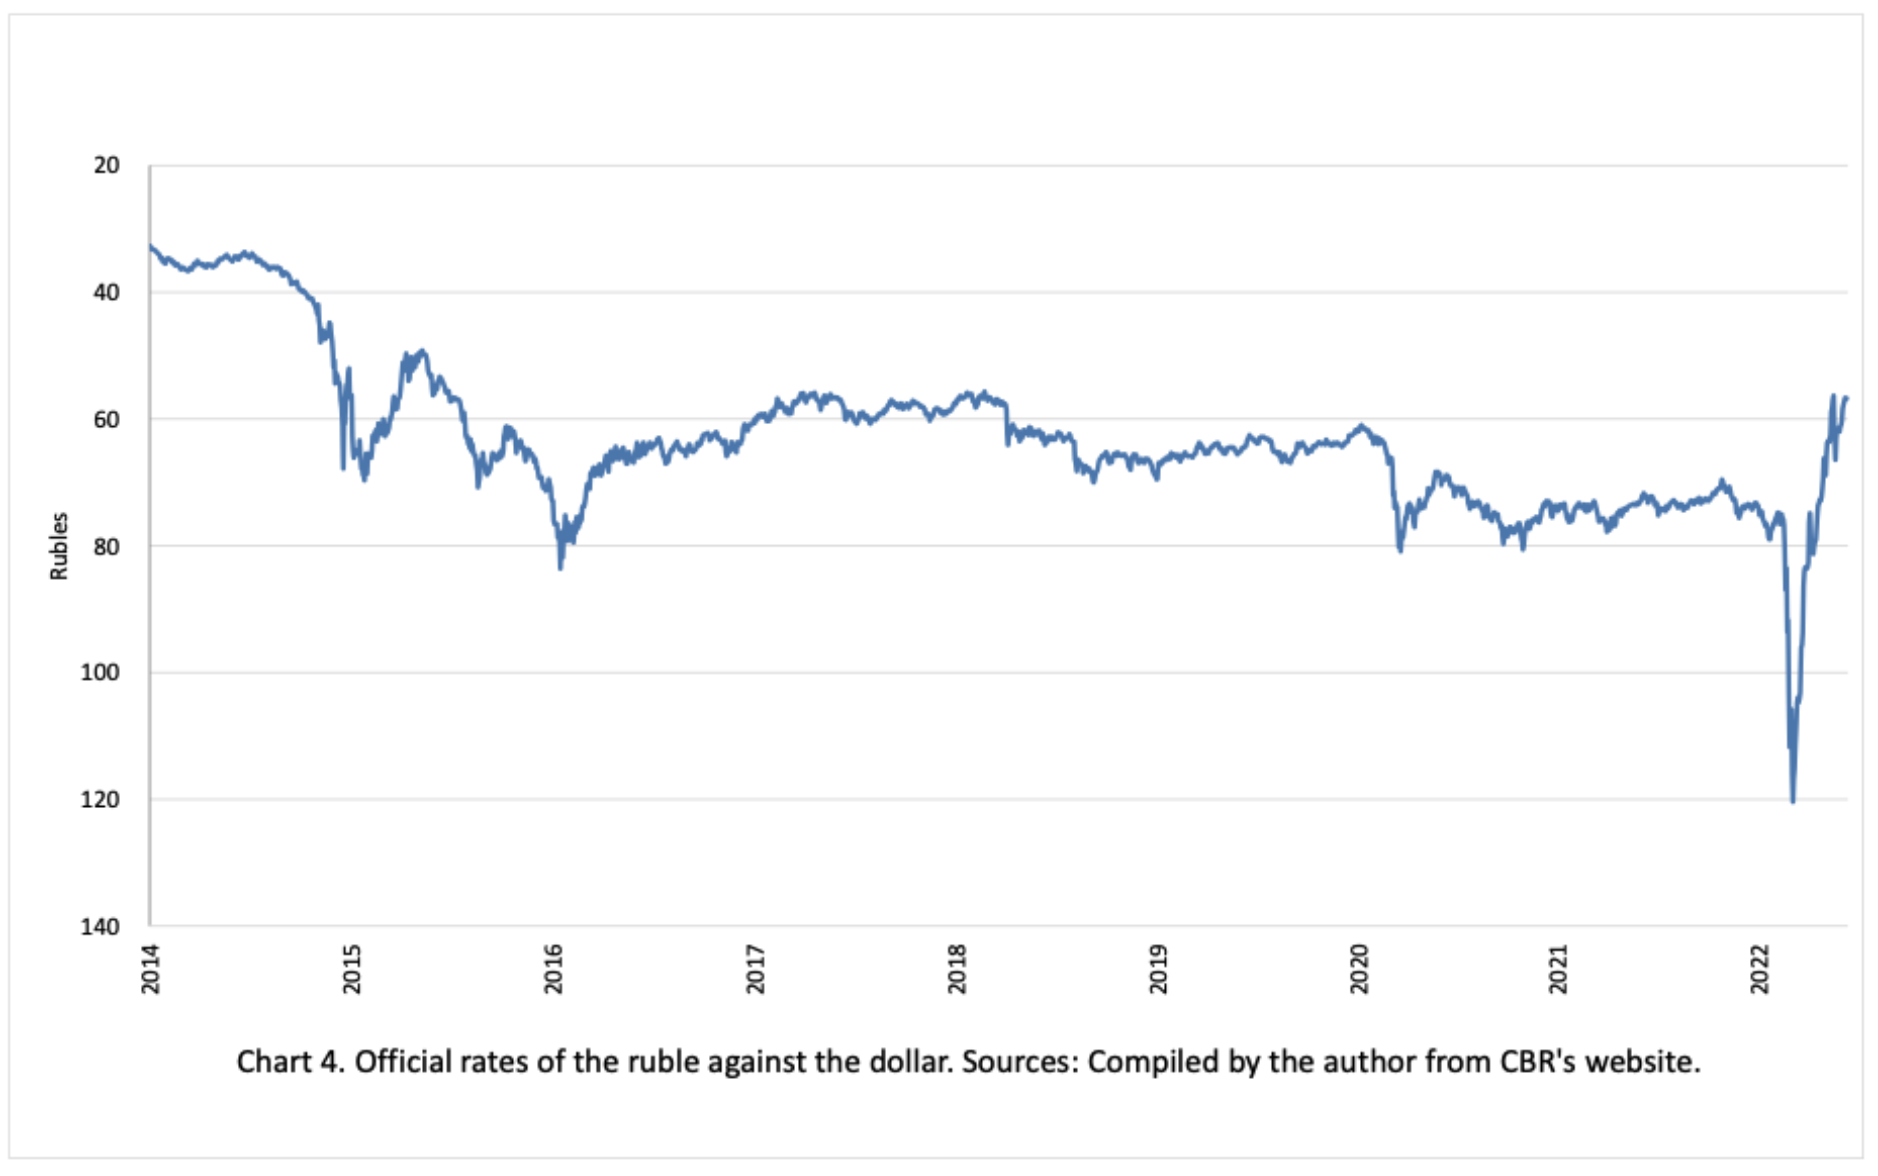
The exchange rate for Russian ruble plummeted from the end of February to the end of March 2022 (Chart 4), falling 38% from 74.7 rubles to the US dollar on February 11 to 120.4 rubles to the dollar on March 11. However, the ruble appreciated rapidly thereafter and returned to its pre-invasion value by around April 9.
One of the major factors contributing to this recovery was the introduction of a measure obliging exporters to sell 80% of their foreign currency earnings (Presidential Decree No. 79, February 28). The continued export of oil, gas, and other commodities, added with soaring oil and gas prices, has resulted in an abundant inflow of foreign currency into the foreign exchange market.
On May 26, the ruble exchange rate rose to 56.3 rubles to the US dollar, the standard around February 2018. Given the high inflation rates, this means that ruble has strengthened considerably in real terms. Taking these circumstances into account, the mandatory sale of foreign currency was reduced from 80% to 50% of acquisitioned foreign currency on May 23 (Presidential Decree No. 303, May 23). As long as exports of oil, gas, and other commodities continue, another collapse of the ruble is unforeseeable.
Chart 4. Official rates of the ruble against the dollar. Sources: Compiled by the author from CBR’s website
5. Foreign Exchange Reserves
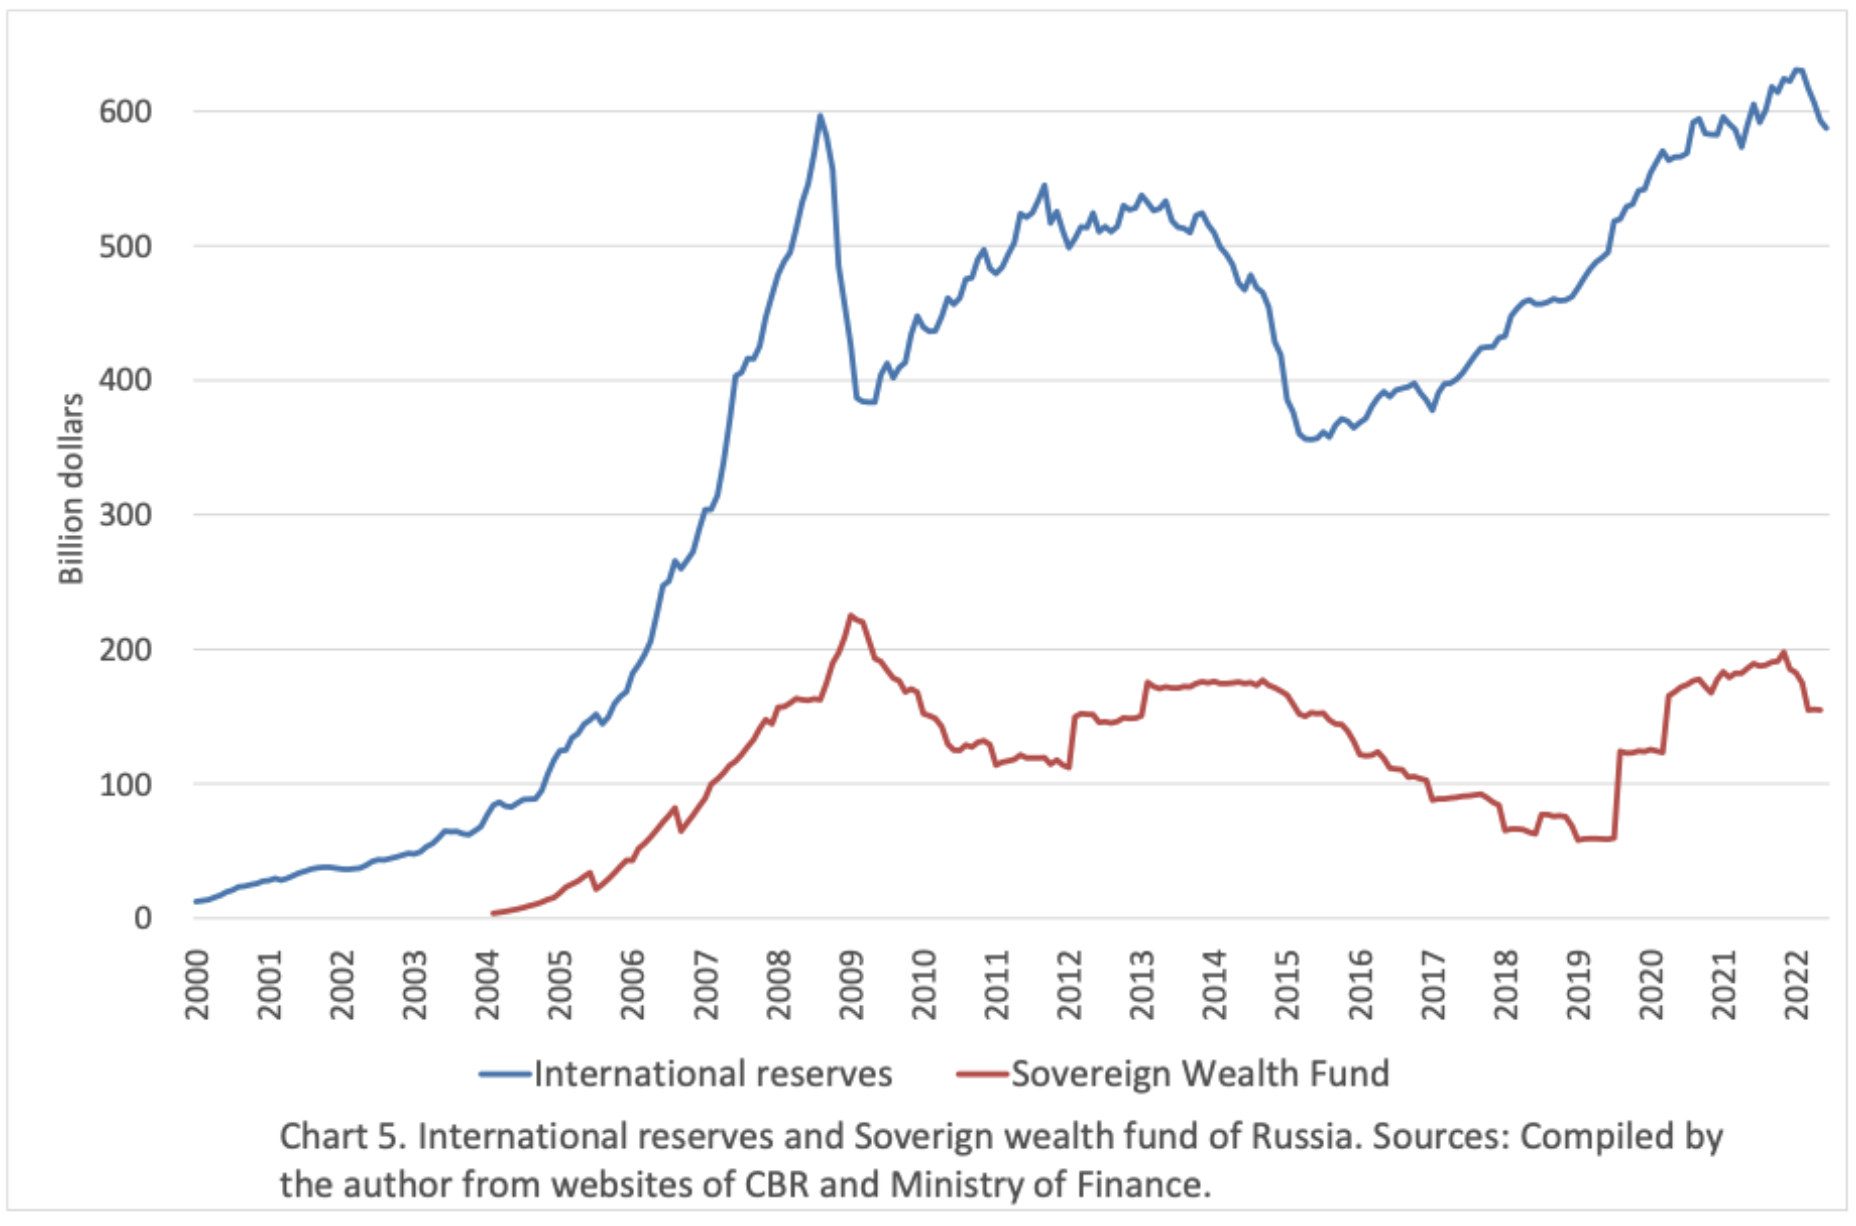
Russia’s foreign exchange reserves reached an all-time high of over $630 billion in 2021 (Chart 5). This is the fourth highest level in the world after China, Japan, and Switzerland. In 2022, the reserve peaked at $643.2 billion on February 18 and has been declining, falling by $37.6 billion from the beginning of the year to the beginning of May.
The Central Bank of Russia announced it would begin intervening in the foreign exchange market, they officially had not intervened since August 2015. The data is available on the Bank’s website (https://www.cbr.ru/hd_base/valintbr/) and shows that intervention took place on February 25 and 28 for a total intervention amount of $1.2 billion.
Although the Bank has stopped releasing data on the breakdown of foreign exchange reserves since March, the decline in reserves since February can be largely attributed to the decline in one part of the reserves: the National Welfare Fund of Russia, a sovereign wealth fund.
As shown in Chart 5, the decline in both the reserves and the Fund have been of similar scale (the decline in the Fund from the beginning of the year to the beginning of May was $27.7 billion). The decrease in the Fund can be attributed to unrealized losses due to the decline in the stock prices of Sberbank and Aeroflot, both of which are held by the Fund.
Chart 5. International reserves and Sovereign wealth fund of Russia. Sources: Complied by the author from websites of CBR and the Ministry of Finance
6. Inflation
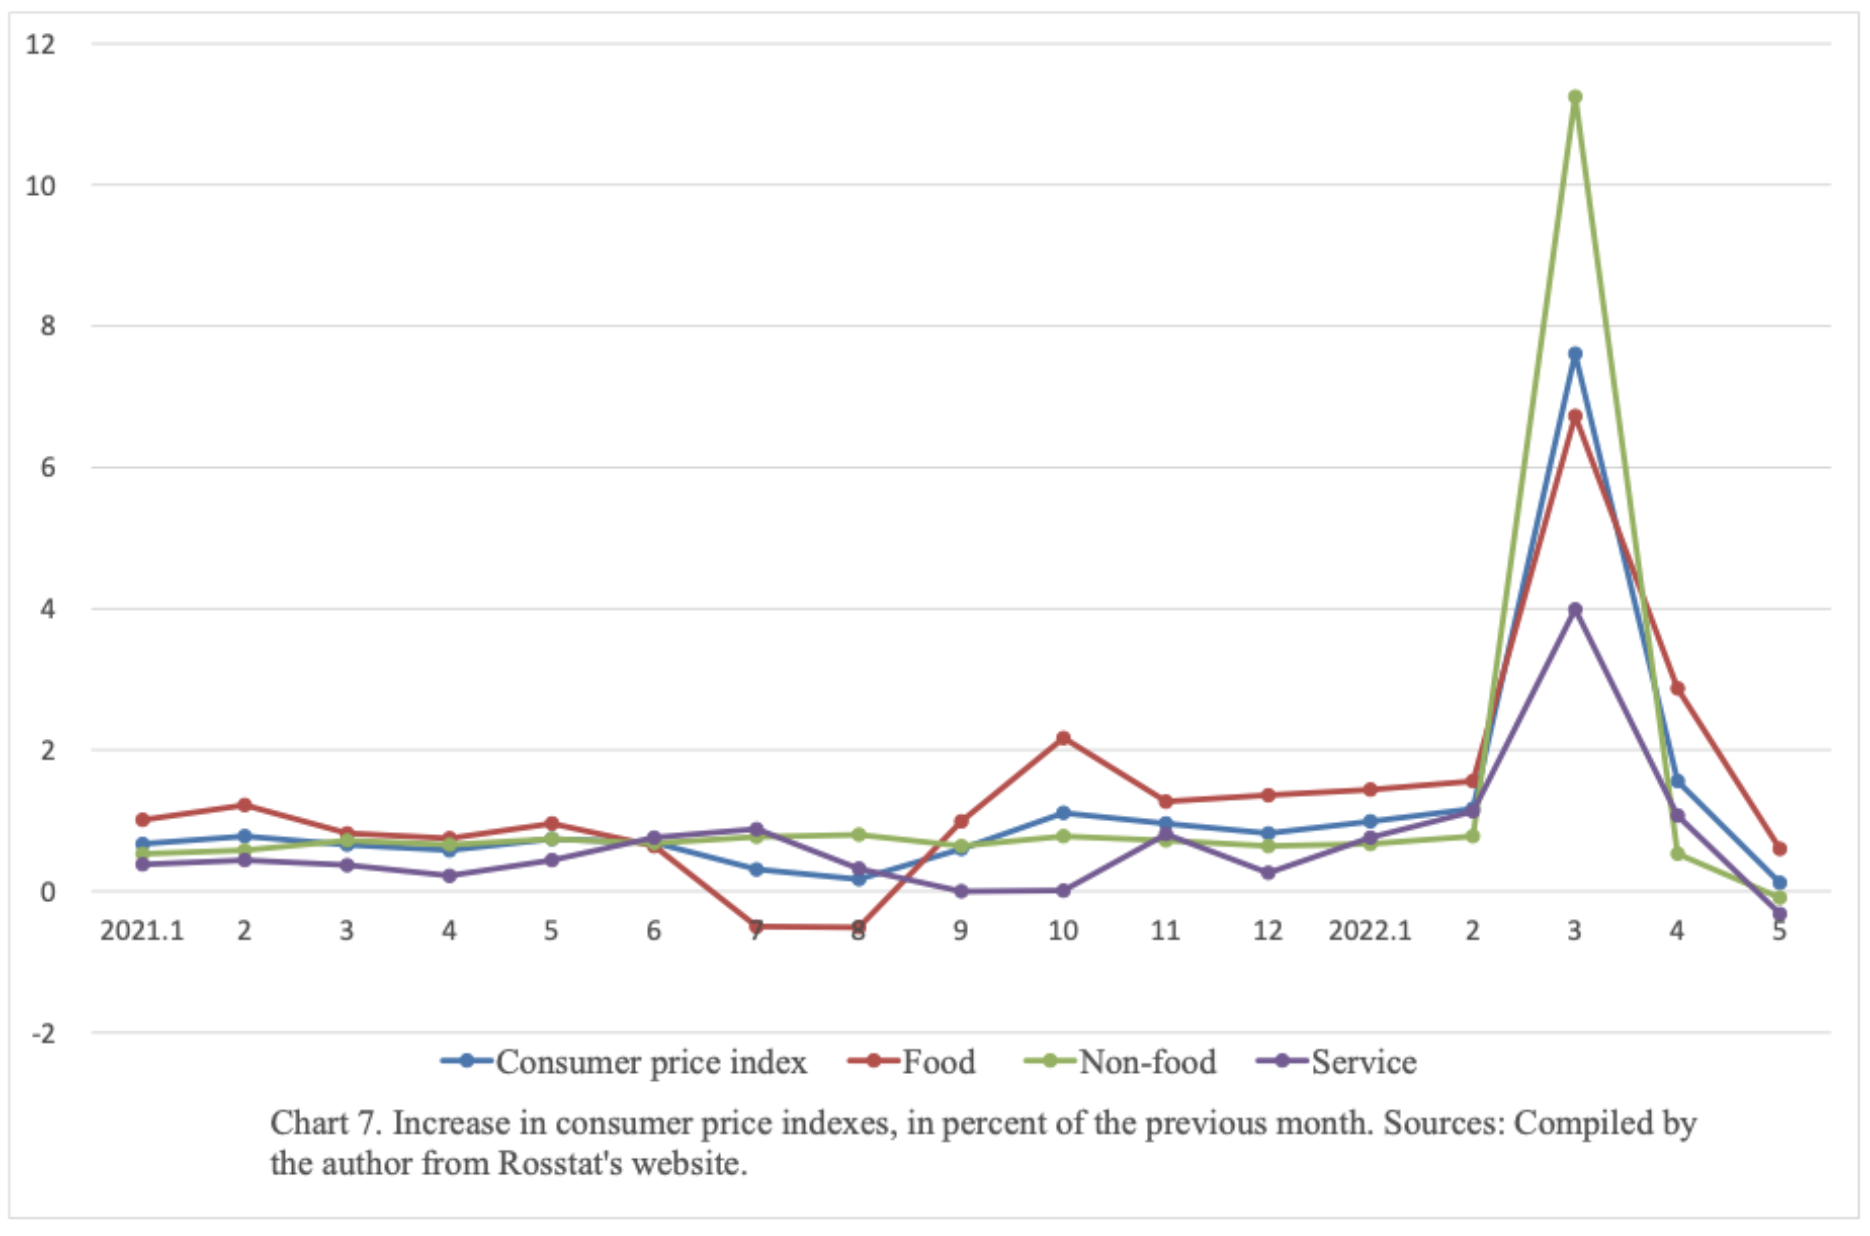
Inflation rate remained at the same level as the previous year until February 2022 (8.4% in 2021) but jumped sharply in March. On a year-on-year basis, inflation was 9.2% in February, 16.7% in March, 17.8% in April, and 17.1% in May (Chart 6). On a month-over-month basis, there was an unusual increase of 7.6% in March (Chart 7). Particularly notable was the increase in non-food prices, which rose 11.3% in March. This rise may have been due to Russians’ panic shopping, reacting to the implementation of sanctions. The ruble’s depreciation during the same period, which led to increasing prices for imported goods, also contributed to the inflation.
In contrast to this March spike, monthly inflation rate fell to 1.6% in April and to 0.12% in May. Non-food items were -0.09% in May. This suggests that the March inflation rate spike was transitory.
However, because of the sharp increase in March, the annual inflation rate for 2022 will be as high as 17%, supposing that the monthly rate of price increase after May is the same as last year’s.
Chart 6. Increase in consumer price indexes, in percent of the corresponding month of the previous year. Sources: Compiled by the author from Rosstat’s website
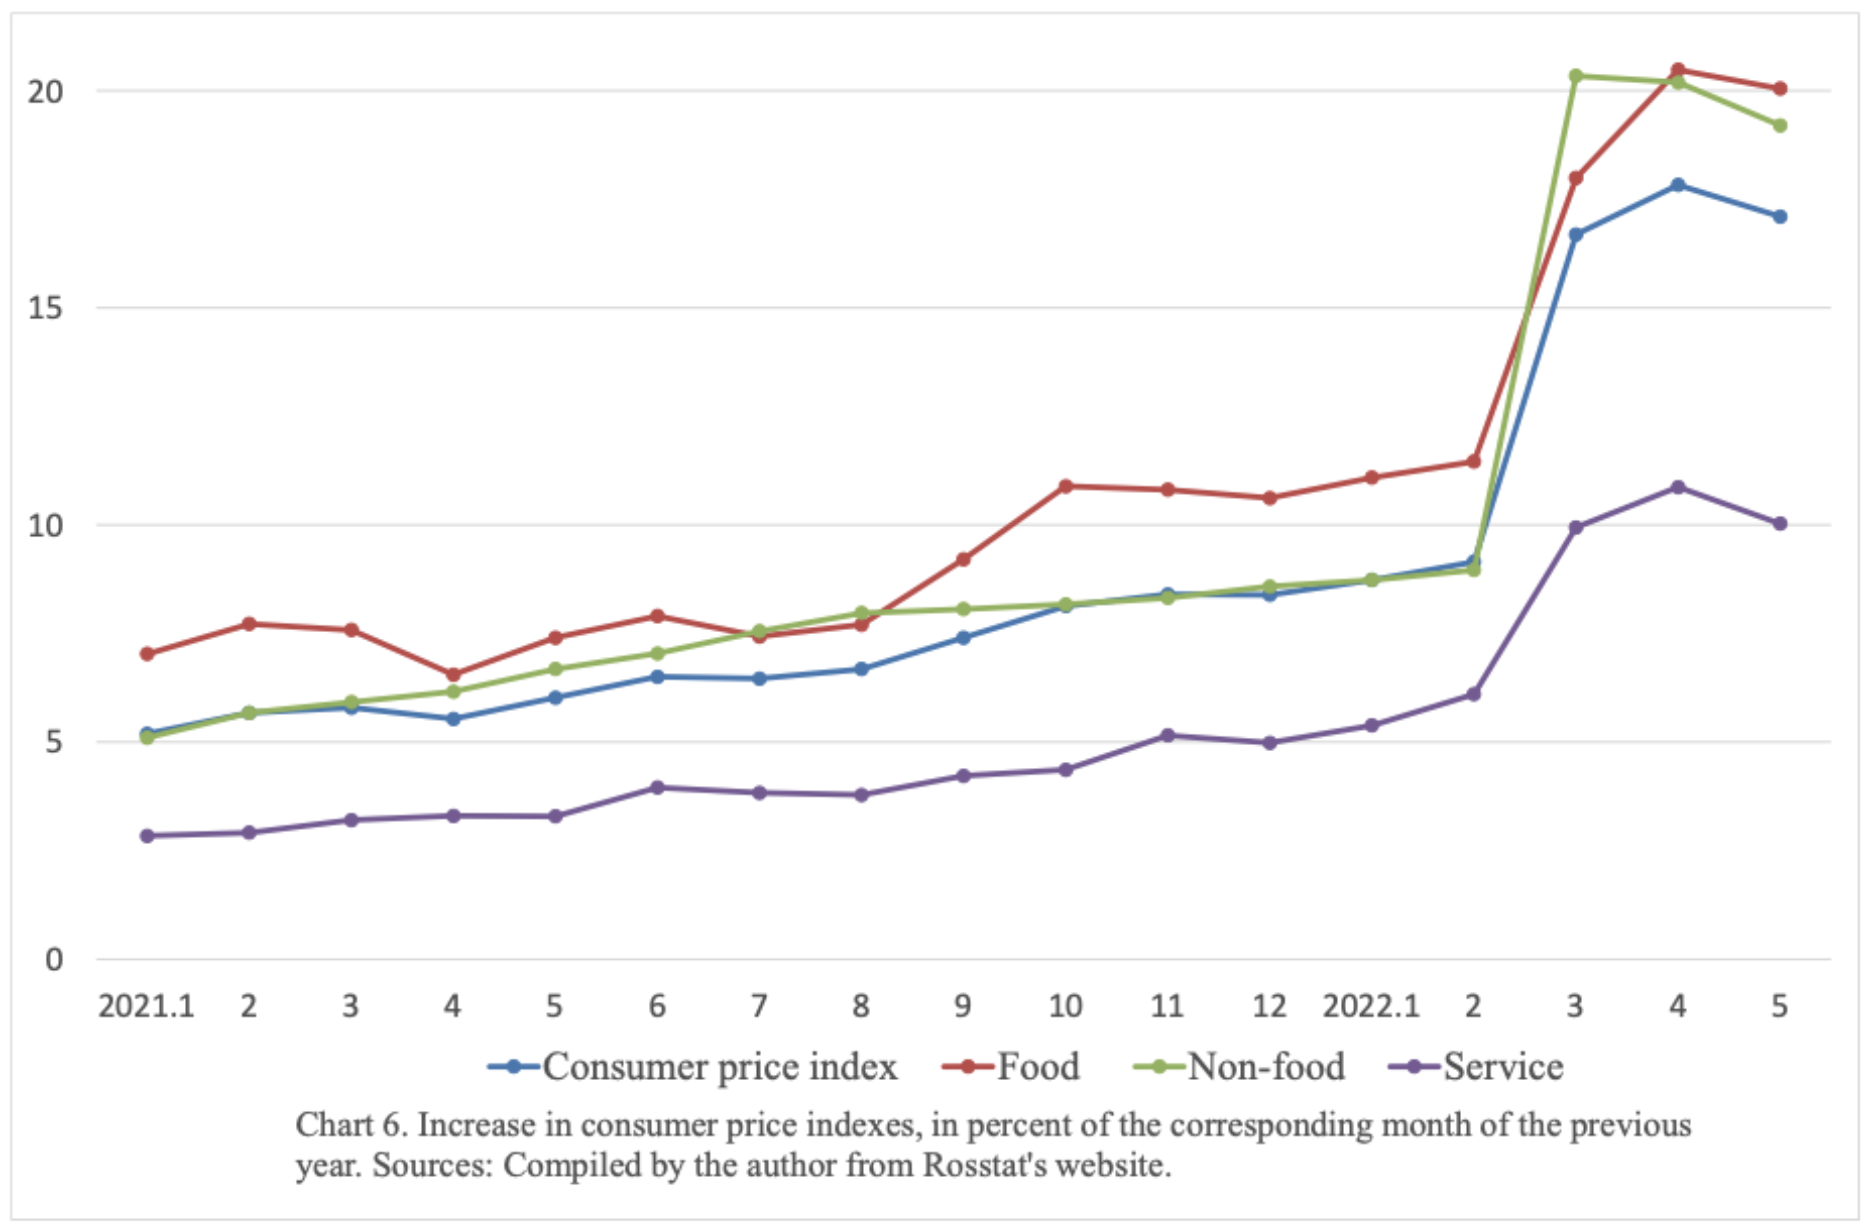
Chart 7. Increase in consumer price indexes, in percent of the previous month. Sources: Compiled by the author from Rosstat’s website
7. Public Finance
Since April, the Ministry of Finance of the Russian Federation and the Federal Treasury have ceased to publish federal budget performance. The federal finances results for January-April shown in Chart 8 are based on data published by Economic Expert Group (EEG), a think tank on the Russian Ministry of Finance.
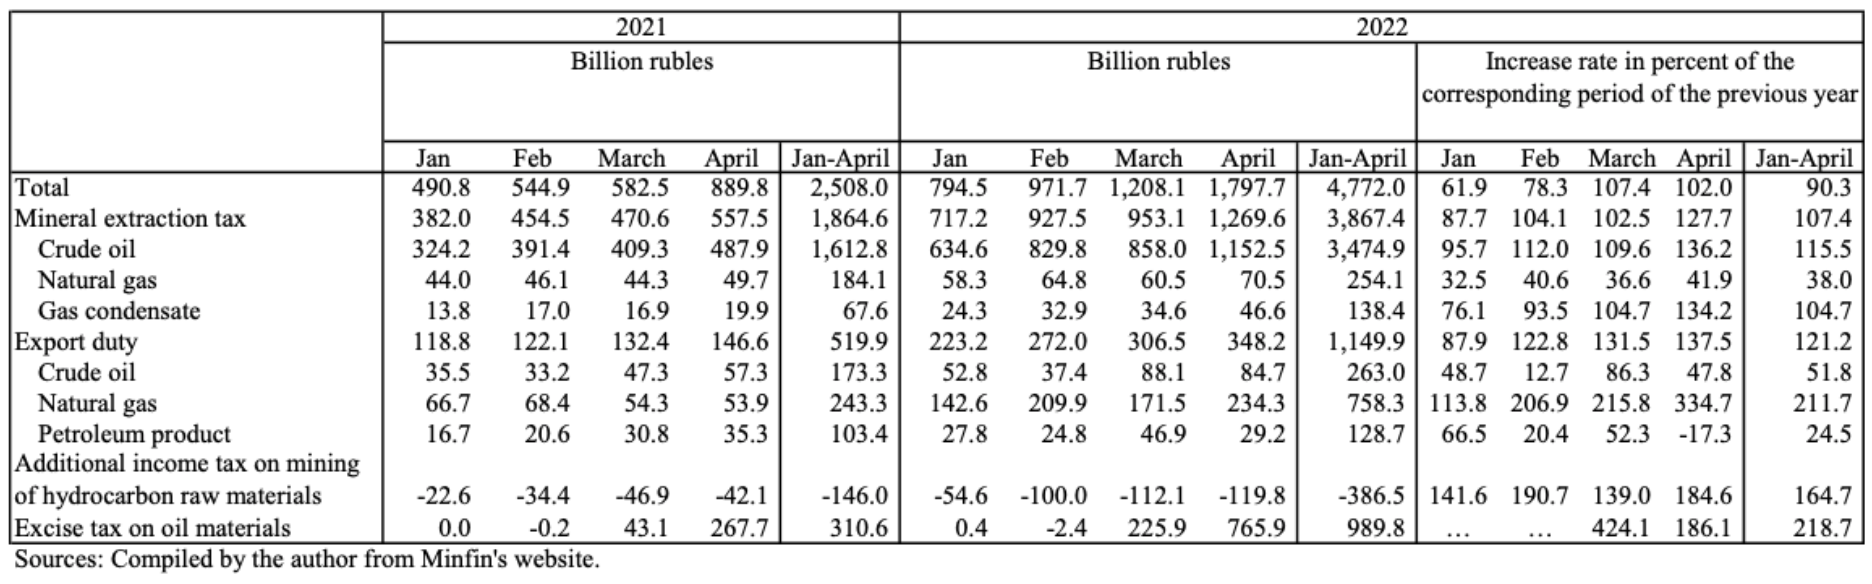
According to the report, total revenue increased by 34.0%. This is due to a considerable increase in oil and gas revenues. As of May, the Ministry of Finance published the breakdown data of oil and gas revenues for January-April (Chart 9; the Ministry’s website is currently inaccessible). The majority of oil and gas revenues comes from mineral extraction tax and export duties. Compared to the same period of last year, total oil and gas revenues in January-April 2022 increased 1.9 times, while mineral extraction tax and export duties more than doubled. The first reason for this increase is the rise in oil and gas prices. Second, the West did not reduce its imports of oil and gas from Russia as much in January-April. Oil and gas revenues are included in “natural resource use tax, payment, etc.” and “revenues from foreign economic activities” in Chart 8, and these revenues have increased significantly. Value-added taxes increased by 5.0% in comparison to last year but given the inflation rate of nearly 20%, this represents a substantial decrease in real terms.
In the January-April period, the year-on-year increase in total revenue exceeded the increase in total expenditure, and the budget surplus more than tripled (Chart 8). However, looking at the results for April alone, expenditures such as national defense increased sharply, resulting in a rise in spending and a budget deficit. National defense expenditures increased 46.2% compared to last year’s January-April period. The overall finance in 2022 is expected to face a deficit, the scale of which depends on what happens to oil and gas revenues in the future.
In Russia, when budget deficits occurred, they were usually compensated by drawing down the National Welfare Fund, a sovereign wealth fund, rather than by government bonds. This fund’s primary role is to cover budget deficits when oil prices are low, and is formed by accumulating a portion of oil and gas revenues when oil prices are high. As seen from Chart 5, the Fund has been increasing since 2019, but has been decreasing slightly in 2022. According to documents from the Ministry of Finance and EEG, there were almost no disbursements from the Fund in January-April of this year, and this decrease can be attributed to unrealized losses on the shares of Sberbank and Aeroflot held by the Fund.
Chart 8. Federal budget performance of Russia, in billion rubles
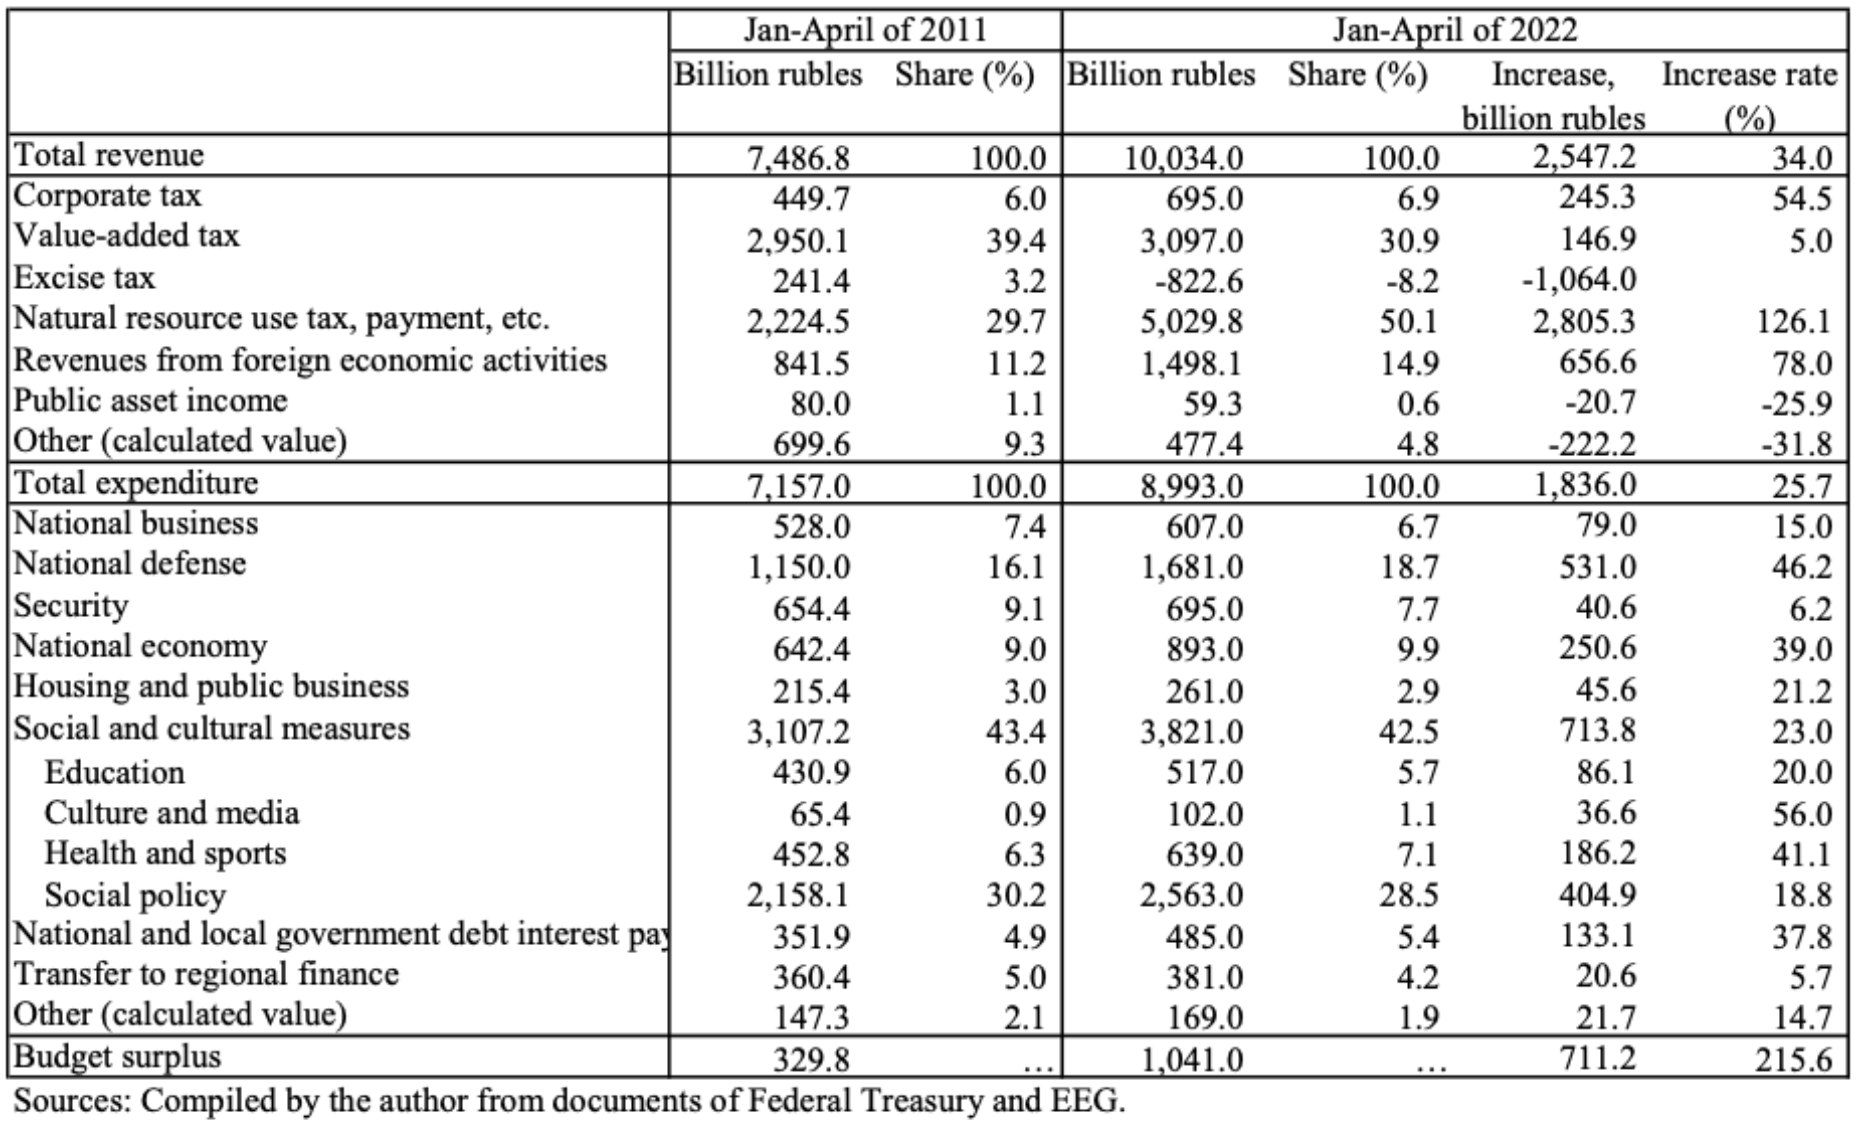
Chart 9. Oil and gas revenues of Russia
This commentary is the author’s personal views and does not represent the views of the University.